LU-8010 Controlled Irradiance in Laboratory Weathering:
Technical Bulletins
Posted 2023
Last Updated 2023
LU-8010
Limitation in the State of the Art
Lightfastness and weatherability are necessary qualities for many materials used in the automotive industry. Because outdoor exposures are time consuming and the weather is variable from year to year and place to place, accelerated laboratory testers are widely used in the industry. In addition to speed, one proclaimed advantage of laboratory weathering testers is reproducibility of test results. To achieve this reproducibility, testers need to have control of the critical parameters of light, moisture, and temperature.
Accelerated weathering testers employ a variety of light sources to simulate sunlight and the damage caused by sunlight. Different types of carbon arcs, xenon arcs and fluorescent UV lamps are commonly used. Each light source has a different emission spectra. 1 Because all of these light sources lose output over time, some form of compensation is necessary to achieve reproducible results. This study examines problems with the control of light irradiance that result from the type of control systems used in various accelerated testers.
Significance
Control of irradiance in a laboratory tester is important because any changes in a light source’s output will usually have one of the following effects:
- Changes in light intensity (i.e., brightness) frequently affect the speed of a material’s deterioration.
- Changes in a light source’s Spectral Power Distribution (SPD) frequently affect not only the speed, but also the type of material degradation.
Each device investigated uses a different system for controlling irradiance. Carbon arcs’ burner rods require daily replacement. Xenon arcs are often equipped with a feed back loop system that monitors the burner’s light output over a particular wavelength range and attempts to compensate by increasing the wattage to the burner. Fluorescent testers, depending on the model, use either a feedback loop system or a rotation/replacement system to maintain irradiance.
For purposes of this discussion, the following definitions are necessary:
Irradiance is the rate at which light energy falls on a unit area of surface.
Spectral irradiance is the distribution of irradiance with respect to wavelength.
Solarization is the loss of the ability of a filter to transmit light due to the filter’s exposure to short wave - length UV radiation. The loss of transmission is inversely proportional to wavelength (i.e., the ability to transmit shorter wavelength UV is more greatly effected than the ability to transmit longer wavelength visible light). Upon the filter’s exposure to UV there is usually a very rapid initial change in transmission, followed by a more gradual, continuing deterioration. Solarization and “aging” are often used synonymously.
Experimental
A spectroradiometer was used to measure the spectral irradiance received by test samples exposed in accelerated testers (details on instrumentation in annex). Except where noted in the report, the irradiance was measured at each 1 nanometer (nm) wavelength band throughout the UV and at every fifth 1 nm band in the visible region of the spectrum. Measurements were taken with the sensor in the same position as an ordinary test sample, so that the irradiance measured would be the same as a test sample receives. The resulting Spectral Power Distribution (SPD) curves were plotted as graphs of irradiance (W/m 2 ) versus wave length (nm). Graphs of percent spectrum change were also generated from the same data to further illustrate any change in SPD. Because of instrumental limitations in the measurement of extremely small irradiance values, percentages are shown only for irradiance values greater than .01 W/m 2 /nm (or 1 mW/cm 2 ).
Carbon Arc
“Sunshine” and “enclosed” carbon arc testers utilize carbon rods which are “burned” to produce light. The carbons last for about 23 hours and have to be replaced daily. The total output and emission spectra may vary from one carbon rod to another. This may create variability in results from short term tests. It may or may not cause problems for exposures that last several weeks, where the differences in carbon output may be averaged out.
A more important cause for variability in results from carbon arc testers is filter aging. Upon exposure to short wavelength UV light, carbon arc filters lose some of their ability to transmit light. As reported by Ketola,2 a haze that is obvious to the naked eye builds up on the filter over time. In addition, smut from the combustion process is deposited on the filters and must be removed daily. Imperfect cleaning further contributes to a lack of uniform irradiance in carbon arc testers.
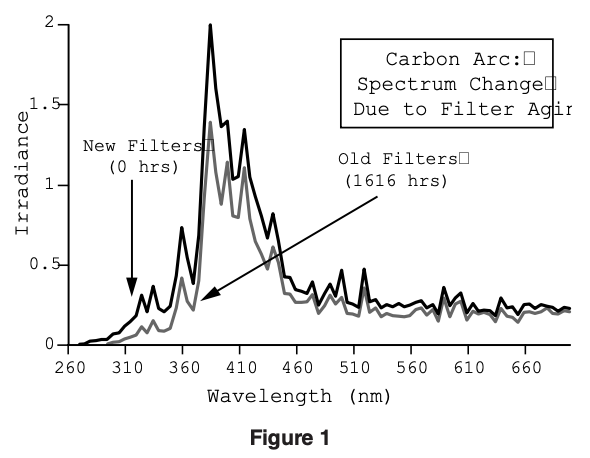
The change in transmission that occurs from solarization, hazing and smut is important throughout the longer visible portion of the spectrum, but it is especially significant in the shorter, more damaging UV wavelengths. Consequently, carbon arcs with new, unsolarized filters have a different SPD than testers with older filters. Figure 1 shows the SPD of a sunshine carbon arc measured with new Corex filters, compared to the same burner measured with older solarized and hazed filters.
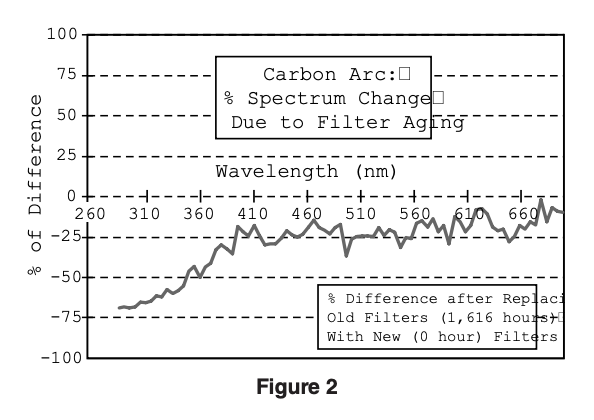
Figure 2 illustrates the percent change in the spectrum between old and new filters. The drop in visible light output is about 20%. The change in the more damaging UV approaches 70%. Changes in spectrum of this magnitude will make significant differences in test results.
Xenon Arc
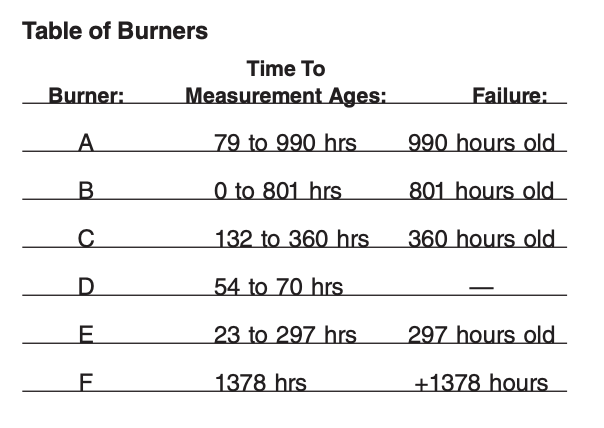
Three water cooled, “controlled irradiance” xenon arcs were measured in two different laboratories. Two of the testers were 6500 watt devices and one was a 3500 watt device. Six separate burners were measured at various times throughout their lives. Except where noted, they were measured in the SAE J1885 configuration (i.e., quartz/borosilicate filter combination, .55 W/m2 irradiance at 340 nm). Only one of the burners examined was able to maintain the .55 irradiance level for 1000 hours. Most had to be replaced significantly earlier. The table below shows the measurement ages and burner life for each arc used in this study. Different burners exhibited varying rates of aging, filter solarization and fogging. Figures 3 through 6 are measurements of one particular xenon burner. It was chosen because its performance was typical of the population examined.
Xenon Arc Irradiance Control
“Controlled Irradiance” xenon arc models have a light monitoring system designed to compensate for the inevitable light output decay due to lamp and filter aging. The operator presets a desired level of irradiance. As the light output drops off, the system attempts to compensate by increasing the wattage to the xenon burner. Three factors cause difficulty in controlling irradiance from a xenon burner: solarization of the filters, solarization of the burner envelope, and fogging of the burner envelope.
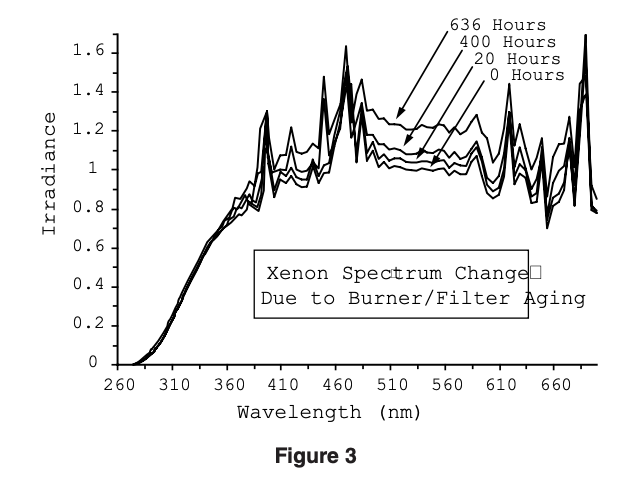
Each of these three factors cause the xenon SPD to change non-uniformly: the short wavelength output drops off more rapidly than the longer wavelength output. Figure 3 shows the SPD of one burner measured at four different times in its life. Irradiance is monitored and controlled only at 340 nm. A wattage increase that is sufficient to maintain irradiance at 340 nm is not enough to compensate for the fall off below 340 nm. At the same time, the higher wattage causes a significant increase in the visible light output from the burner. This changes the spectral power distribution of the lamp.
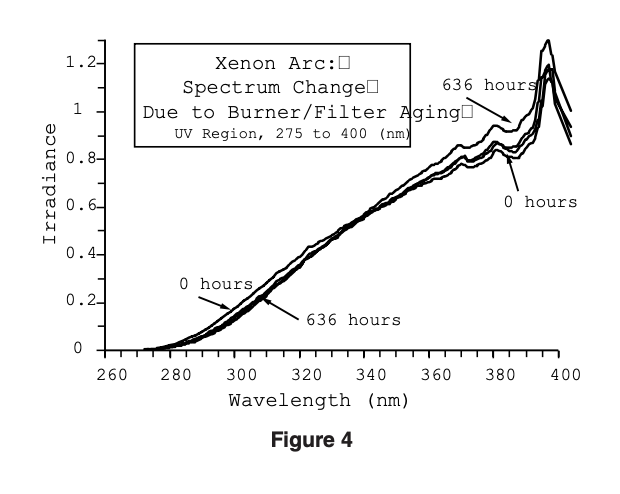
Figure 4 shows the same data graphed to expand the UV region. It shows that, while the irradiance controller does a good job at 340 nm, there is a drop in irradiance in the critical short wavelength UV portion of the spectrum. In absolute values, this drop doesn’t appear important, but when considered as a percentage change it is very significant.
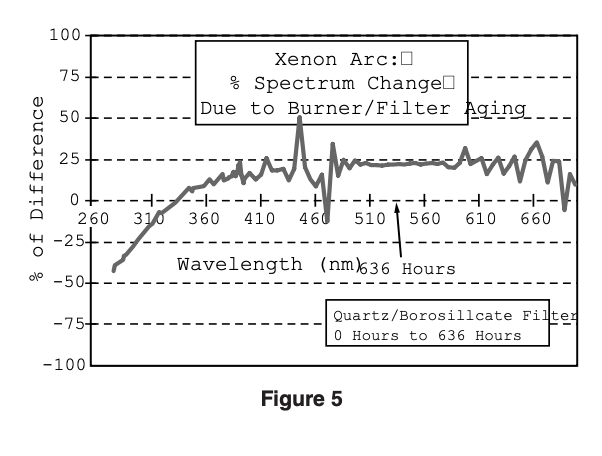
Figure 5 shows the % change in irradiance, as a function of wavelength, between a new burner/ filter system vs. the same system measured at 636 hours. The drop in irradiance in the critical short wavelengths becomes more severe with decreasing wavelength. The most severe, short UV wavelengths have lost more than 40% of their initial irradiance. Conversely, the long wavelength (visible) irradiance has increased by almost 25%. Although the IR portion of the spectrum (above 760 nm) was not investigated, it is reasonable to assume that the IR increases proportionally with the visible light. The differences shown here accrue after only 636 light operating hours. Burners run for longer periods show correspondingly greater changes.
Filter Solarization
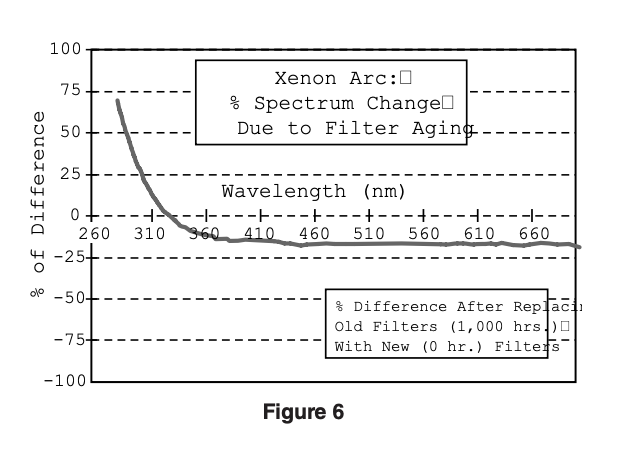
The emission from a xenon arc is modified by the transmission of three components, the burner envelope, an inner filter and an outer filter. Each of these components loses transmission as it is exposed to UV radiation. While the fastest loss of transmission occurs during the first 20 hours of operation, 3 the solarization process continues throughout the lives of the burner and filters. As illustrated below, the greatest change is in the transmission of short wavelength UV. A xenon burner and filter system that was operated for 1,000 hours and could no longer reach the .55 irradiance level was measured with the irradiance set at .35 W/m2 at 340 nm. After new inner and outer filters were installed, the same burner was again measured at .35. Figure 6 shows the effect of filter solarization on irradiance expressed as % change in irradiance due to installation of new, unsolarized filters. The increase in irradiance at the shortest UV wavelengths was about 70%. The decrease in visible light was about 15%.
Fogging the Burner Envelope
An additional complication in maintaining xenon arc irradiance is caused by a non-uniform deposition of tungsten that frequently forms on the inside of the burner envelope. The deposit is caused by sputtering from the cathode and seems to increase with increasing wattage. This fogging phenomena was identified over 20 years ago, 4 but presents particular problems for today’s testers with light sensors. This deposit is almost transparent to visible light, but acts as an efficient filter of the damaging, short wavelength UV. As the monitoring system attempts to compensate for the fall off in UV, it causes additional increases in the visible light portion of the spectrum.
Because the deposit is not uniform, the irradiance around the circumference of the burner varies. This difference is averaged out for the samples which ride around the burner on a carousel. However the irradiance controlling sensor is stationary and can only monitor the burner from one angle of view. This leads to errors because the amount of the tungsten deposit differs in both the area it covers and in its thickness. A light sensor that is monitoring a section of the burner with a thick deposit of tungsten will register different irradiance than a sensor that is monitoring a relatively clear section of the burner.
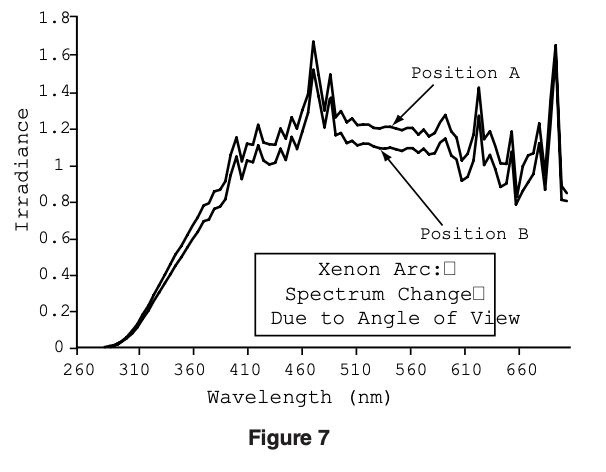
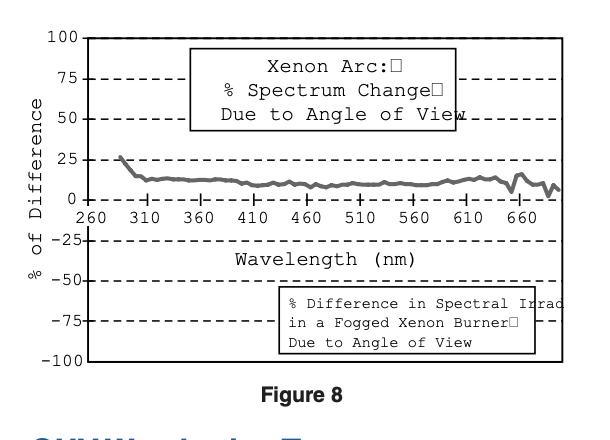
Figure 7 shows the SPD of one xenon burner, measured from two different angles of view. The difference shown is approximately 15%. Differences of similar magnitude have been frequently reported (as indicated on the unit’s built-in irradiance control monitor). Because the test sample rotates around the burner, the sample is exposed to the average irradiance. But if the irradiance controller is monitoring a “hot” section of the burner, the average may be 7% lower than assumed. If the controller is looking at a heavily fogged section of the burner, the samples will be exposed to 7% higher irradiance than the irradiance controller indicates. Figure 8 shows the same data as percent spectrum change
QUV Weathering Testers
The QUV® Accelerated Weathering Tester uses fluorescent UV lamps to simulate the effects of sunlight. One advantage of fluorescent lamps is their spectral stability throughout their life. In other words, although fluorescent lamps loose output (i.e., brightness) as they age, their spectrum remains essentially the same. This consistency of spectrum allows simplified control of irradiance. Four different types of fluorescent lamps are widely used for weathering. The particular testing application determines which lamp is used. The FS-40 and the UVB-313 are commonly known as “UV-B lamps.” UV-B lamps are the most widely used in the QUV tester. They allow maximum acceleration but, due to short wave UV emission, may be unrealistically severe for some materials. The UVA-351 and UVA-340 are known as “UV-A Lamps.” Because their emission spectra is a better match with sunlight, they typically give less acceleration than UV-B lamps, but more realistic test results. All of these fluorescent lamps differ in the following ways:
- Total amount of UV energy emitted
- Emission spectra
- Rate of light output decay
QUV Solar Eye Irradiance Control5
The QUV’s SOLAR EYE® irradiance control system (used in models QUV/se and QUV/spray) consists of a programmable controller that continuously monitors the UV intensity via four sensors mounted in the test sample plane. A four channel feedback loop system maintains the programmed irradiance level by adjusting power to UV lamps. Figure 9 shows a simplified schematic of how the irradiance control system works. With the SOLAR EYE, the user sets the level of desired irradiance and the SOLAR EYE maintains it automatically.
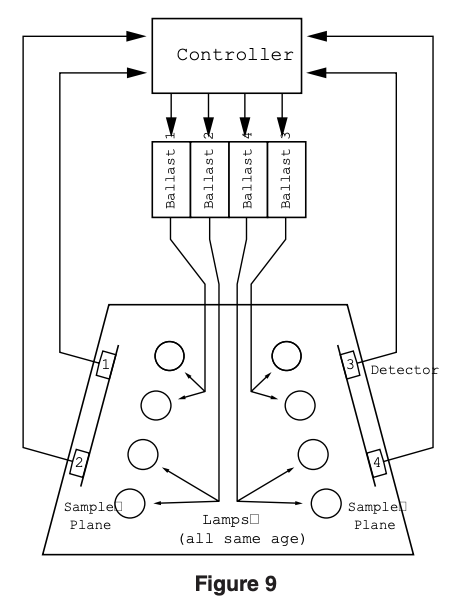
Each sensor monitors the intensity of two lamps. Each sensor is individually calibrated by the operator on a regular basis. The calibration is traceable to the U.S. National Institute of Standards and Technology (NIST). Unlike xenon arcs, fluorescent UV lamps degrade uniformly at all wavelengths during lamp aging. Consequently, there is no significant change in the spectral power distribution of the lamp. This is a great advantage for reproducibility. Figure 10 shows the SPD of two sets of QFS-40 lamps measured in a QUV/se. One set of lamps was aged only 2 hours and the second set was aged 5600 hours. The spectral distribution is the same even at very different lamp ages.
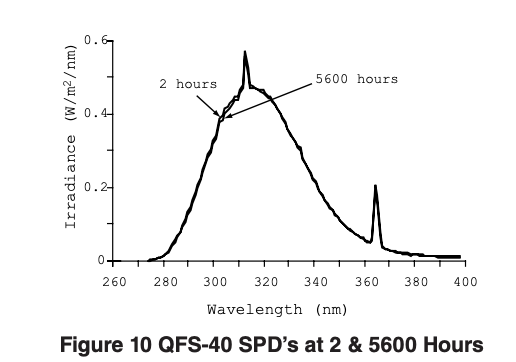
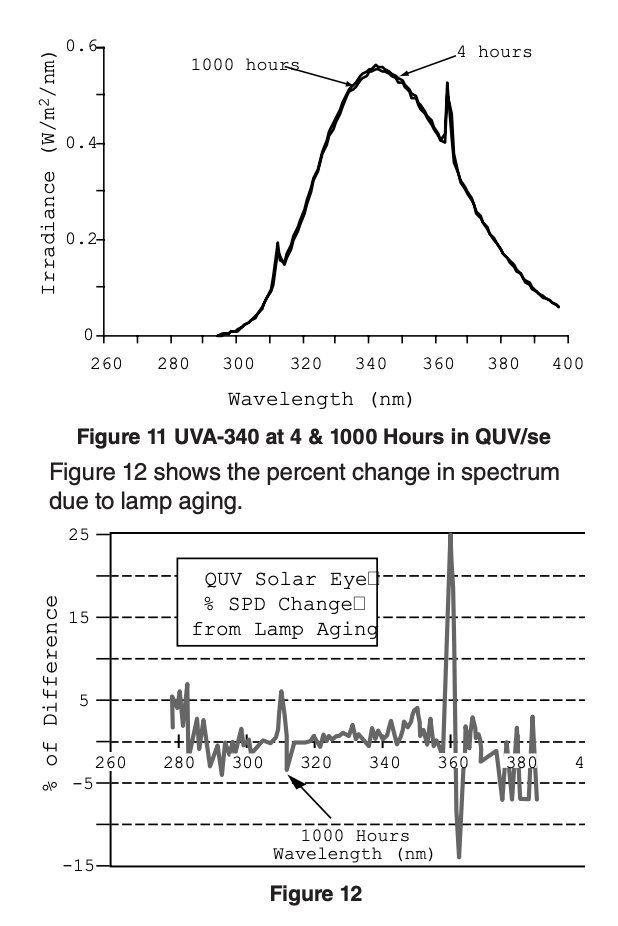
Figure 11 shows SPD’s of a set of UVA-340 lamps first measured at 4 hours and then aged 1000 hours and remeasured. Again, the spectral distribution is nearly identical.
Another advantage of the SOLAR EYE is that a push-button irradiance setting allows you to fix the exact irradiance level. With the UVA-340 lamp you can operate the SOLAR EYE at various levels for different applications and still maintain realistic test conditions.
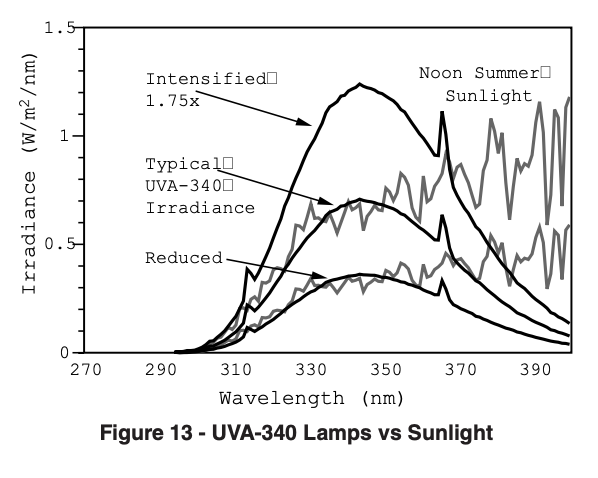
For example, as shown in Figure 13, with the UVA-340 lamps you could set the Solar Eye to simulate any of the following sunlight conditions:
- Intensified 75% (higher than QUV/basic) for fast results.
- Typical (equivalent to noon summer sunlight) for quick results without sacrificing correlation. T his is the irradiance of a QUV/basic.
- Reduced to .35 W/m2/nm at 340 nm to match so-called “Average Optimum” sunlight or Xenon.
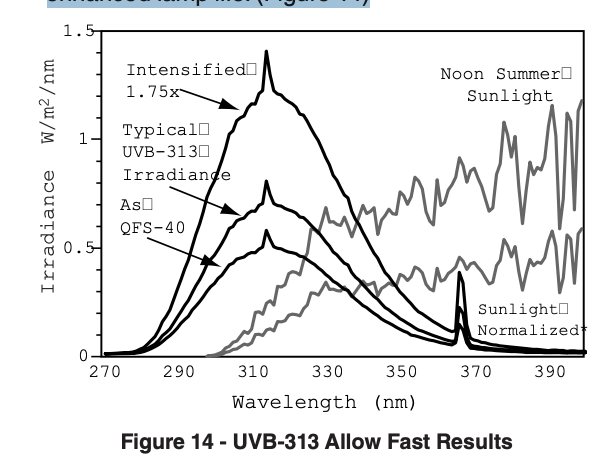
Using UVB-313 lamps, you can operate at Intensified (1.75x) (75% higher than standard) for extremely fast tests, for Quality Control applications, or for testing very durable materials. Y ou can also set the irradiance level to be equivalent to the QFS-40 lamp and reap the benefits of greatly enhanced lamp life. (Figure 14)
The QUV/basic and Manual Irradiance Control
The QUV/basic is the original version of the QUV Accelerated Weathering Tester. It is still widely used in labs where economy is critical. It has the same features same as the QUV/se, except for the SOLAR EYE irradiance control system. In the QUV/basic, irradiance is not adjustable; the tester compensates for lamp aging by a simple rotation/ replacement system.
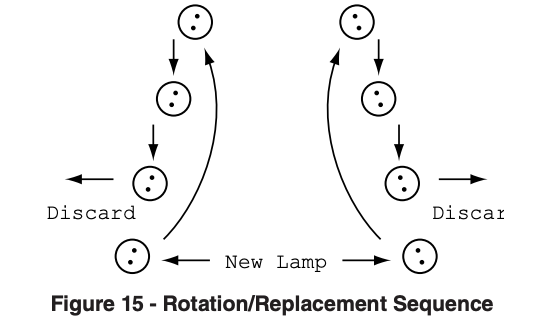
Lamp Rotation/Replacement System. Each tester uses eight lamps; four on each side. Irradiance is controlled by replacing the oldest lamp in each bank every 400 hours of lamp operation. At that time the remaining six lamps are rotated as shown in figure 15. The irradiance that the test specimen receives is therefore an average of lamps at four different points on the age/output curve. This average remains relatively stable over time.
There are two inherent weaknesses in this system. First, there is no way to compensate for any lot to lot differences in lamps due to manufacturing limitations. Second, because lamps deteriorate with age, there is a drop in light output between rotations. Depending on the rate of aging, this drop is more or less significant.
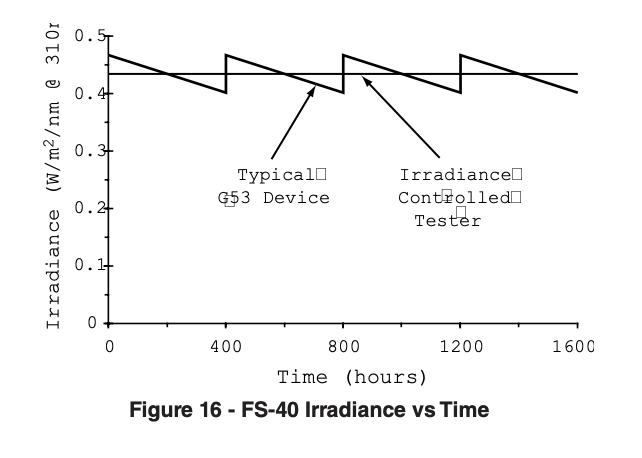
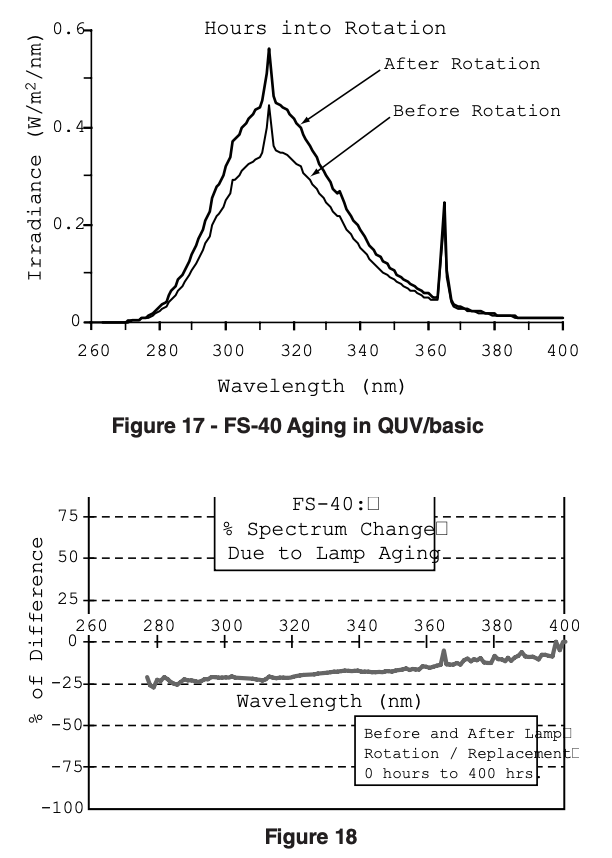
FS-40 Lamp in a QUV/basic
The FS-40 (F40 UVB) has been widely used for testing automotive coatings since the mid 1970’s. As illustrated in Figures 16 & 17, the FS-40 shows a drop in irradiance during the recommended 400 hour rotation/replacement sequence. Figure 18 shows the data graphed as percent spectrum change. The aging of the FS-40 is not perfectly uniform across the spectrum. There is slightly more drop off in irradiance in the very short wavelengths, apparently due to solarization. Over all, there is a drop of approximately 20 percent in the course of the 400 hour rotational sequence. The FS-40 lamp shows the worst aging and worst spectral stability of all the fluorescent lamps commonly used in the QUV weathering tester.
UVB-313 Lamp in a QUV/basic
Because of it greater stability, the UVB-313 has replaced the older FS-40 as the UV-B lamp of choice for most applications. Figure 19 shows the UVB-313 before and after rotation. The change in output between 0 hours and 400 hours is minimal.
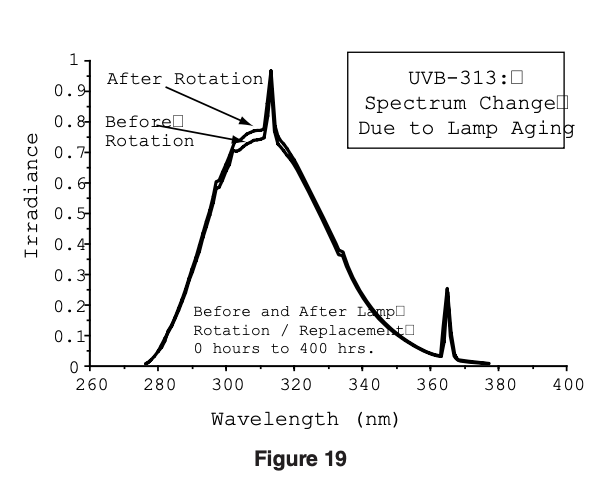
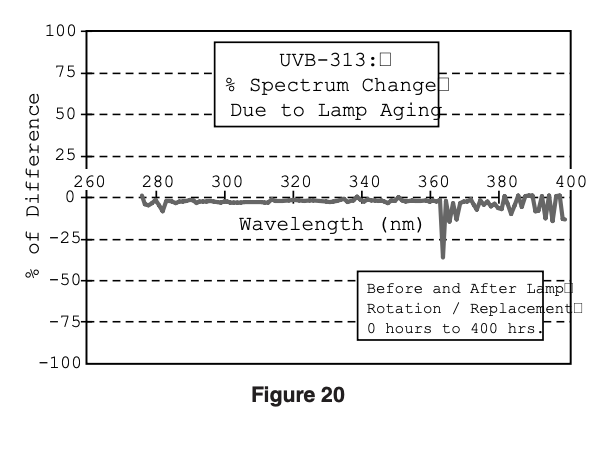
Figure 20 shows the UVB-313’s percent spectrum change due to aging. With the exception of the wavelengths above 365 nm, the change is very uniform. Over all, there is only about a 5% fall off in irradiance between the 0 hour to 400 hour rotation/replacement sequence. This is far superior to the QFS-40 lamp.
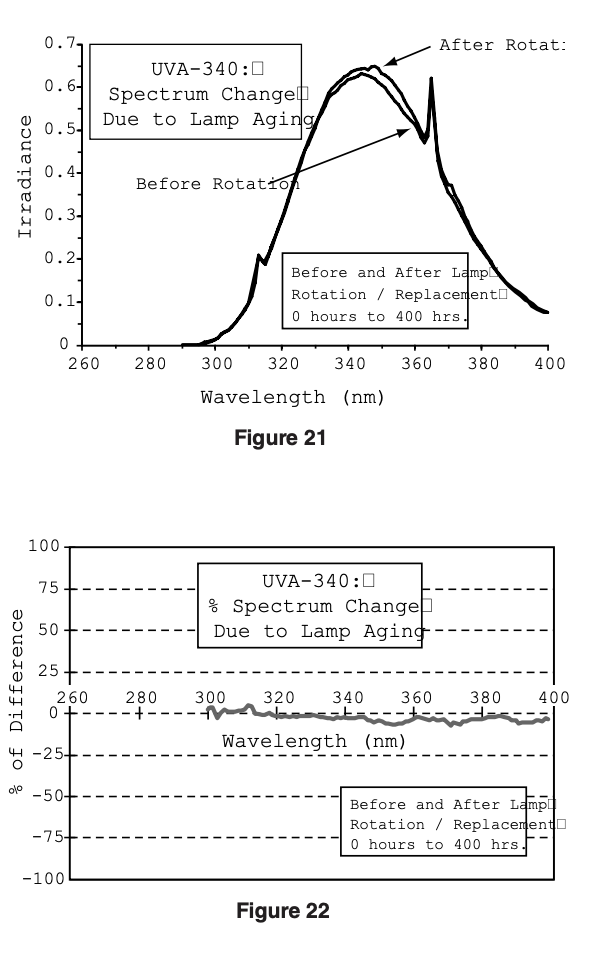
UVA-340 Lamp in a QUV/basic
The UVA-340 was developed to enhance the correlation between QUV’s and actual outdoor exposures. The UVA-340 also shows very little change in irradiance due to lamp aging. Figure 21 shows the change in spectral irradiance due to lamp aging. Figure 22 shows the % spectrum change due to lamp aging for the UVA-340. There is only about a 5% loss of output between rotations.
Conclusions
- Carbon arcs exhibit variability in output due to the aging of their filters.
- Xenon arc testers attempt to compensate for burner and filter aging by controlling output at 340 nm. However, controlling irradiance at one point in the spectrum does not control over the entire spectrum. Over time, filter solarization and burner fogging cause a drop in short wavelength UV emission and an increase in visible light output. The 340 nm control point acts as if it were a fulcrum. The change in spectral power distribution pivots on this 340 nm point.
- The old-style QUV/basic testers, with their rotation-replacement system, have an inherent drop in output built into the system. Different fluorescent lamps exhibit different aging characteristics.
- Of all the common accelerated weathering testers, the QUV/se, with its SOLAR EYE irradiance control system, does the best job of controlling light output.
Caveats
All weathering test chambers attempt to maintain uniform conditions within the chamber. All have some lack of uniformity in temperature, humidity and irradiance. Variability of conditions within a tester is a significant cause of poor correlation between test results.
Furthermore, despite the current interest in light energy, the irradiance of a test device is only one part of the picture. With any accelerated tester, there are a number of critical parameters, including: UV spectrum, moisture, humidity, temperature and test cycle. In addition, the programming of the parameters that one chooses are, to a certain extent, arbitrary. No single test cycle or device can reproduce all the variables found outdoors in different climates, altitudes and latitudes.
Consequently, even the most elaborate tester is really just a screening device. The real usefulness of accelerated testers is that they can give reliable, relative indications of which material performs best under a specific set of conditions.
References
This paper was originally presented at the Industrial Fabrics Association International seminar: New Developments in Automotive Fibers and Fabrics ’88 (Nov. 1988). It was revised in 1994 to bring it up to date with advances in technology.
Acknowledgements
Q-Lab is responsible for the accuracy of this report. However, the authors would like to thank the following for their technical assistance:
Americhem Inc., Cuyahoga Falls, OH
3M Company, St. Paul, MN
Ohio Spectrographic Service, Parma, OH
Annex on Measurement Instrumentation
All measurements were taken with the same instrument to ensure that the various SPD curves would be strictly comparable. Attempting to compare SPD curves generated by different spectroradiometers is a frequent source of error in this field. This is due to different types of input optics, different wavelength bandpasses, or simply due to limitations in the state of the art in spectral irradiance calibrations of diffuse UV sources, like the sky or fluorescent lights.
The instrument used was an International Light IL 700 Spectroradiometer, No. 504, consisting of the following components:
Input Optics: IL-2WE Double Wide Eye, quartz double lens cosine diffuser for wide viewing angle
Monochromator: Kratos GM-200, double grating monochromator with calibrated 1.0 nm band pass, stray light less than 1 part per million.
Detector: PM 270C Photo-multiplier, with an S-5 response, operated from an IL 760 power supply.
Picoammeter: IL 700A Radiometer. Calibration: Microwatts per square centimeter per nanometer, traceable to the National Bureau of Standards. Calibration Certificate: 404045901.