LX-5021 - Rotating vs. Static Xenon II
Technical Bulletins
Posted 2023
Last Updated 2023
LX-5021
Abstract
This paper investigates whether xenon arc testers with a flat specimen array can provide results which are functionally equivalent to the results of the old-style rotating drum testers. Ultimately, the validity of performance-based standards in practice is being evaluated. We tested nine different types of materials involving numerous material categories and degradation modes. Remarkably good agreement was achieved between the flat array and rotating drum xenon exposures. The results indicate that the concept of performance-based test protocols can be successful, as long as comparative filter systems and exposure conditions are properly defined and utilized. Almost all differences in exposure results fall within the normal variability one would expect from any two testers, regardless of the model or manufacturer.
Background
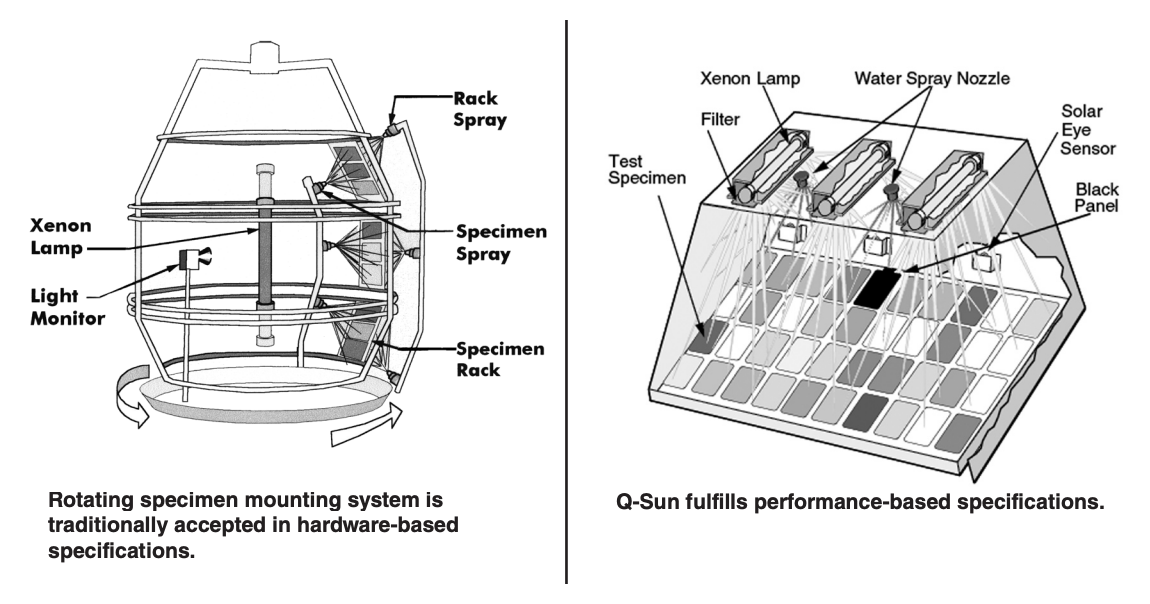
Historically, the majority of xenon arc weathering and light stability testers have been designed with a lamp in the center of the chamber and a cylindrical specimen mounting rack which rotates the test specimens around the light source like a carousel. This specimen mounting system is frequently described as a “rotating drum” and was first introduced with the carbon arc lightfastness tester just after the First World War. There are numerous manufacturers and multiple models and styles of rotating drum style testers. Some of the drums have straight sides and some have several tiers, slanted in toward the light source at various angles in an effort to improve irradiance uniformity. Different manufacturers and models, listed in Appendix A.1, employ various systems and methods to control the critical test parameters of irradiance intensity and uniformity, black panel temperature, chamber air temperature, temperature uniformity, relative humidity, air flow, etc. More recently, Q-Sun testers, which have a static flat plane specimen mounting system, have been introduced (see Appendix A.2). Like the old rotating drum style testers, these flat plane testers use various methods to control the test environment.
“Performance-Based” Standards
Because of the multitude of xenon tester models now available, most technical organizations, including ISO and ASTM, are now encouraging the development of performance-based test methods and procedures. These methods describe the test conditions (e.g., irradiance, spectrum, temperature, humidity, etc.) and acceptable ranges of performance, without requiring the use of any one particular apparatus or hardware configuration. These new documents are replacing the old-style test methods, which were based on descriptions of the hardware (e.g., water-cooled lamp vs. air-cooled lamp). The old fashioned hardware-based approach goes back to the time when we lacked the practical technology to accurately measure and control the critical test conditions. Since we could not adequately characterize the exposure environment, we wrote methods that simply described the apparatus. This approach was based on the hope that, by using the same (or very similar) hardware, we could expose the test specimens to the same stresses and achieve the same result. Unfortunately, this does not always work. The old hardware-based test methods also stifle innovation and improvement because they limit the user to testing by “the way we always did it.” Improved technology and control are automatically precluded. In some extreme cases, some hardwarebased test methods actually specify models of hardware which are obsolete and no longer sold. The newer, performance-based methods have significant benefits for the user. They define the exposure conditions in detail. They allow improvements in technology and control. Finally, they allow competition (which drives down cost to the user). Some examples of this performancebased approach are ISO 4892, ISO 11341, ASTM G151 and ASTM G155.
Inherent Variability Between Lab Weathering Testers
When one compares the results from any two testers, even if the results come from identical models made by a single manufacturer, and even if the tests are performed in the same lab by the same personnel, one must expect a range in exposure results. This may be disappointing to the scientist who naturally desires no variability in results. However, this is a limitation in the current state-of-the-art.
Studies performed by the ASTM Committee G03 on Weathering and Durability compared the consistency of various xenon testers which were all produced by a single manufacturer. The study found that there was an excellent agreement between results when materials were “evaluated in terms of performance ranking compared to other materials or to a control” (ASTM G151). However, even though all the devices were manufactured by the same company, “different laboratories using identical test devices and exposure cycles showed significant variability” in the absolute values obtained (quoted from the ASTM G151 Precision and Bias statement). For a detailed examination of these results, consult Fischer, (1993) and Fischer & Ketola (1995). The ASTM conclusions on tester variability have been essentially reconfirmed by the joint SAE/ IFAI Committee on Textiles and Flexible Plastics every time they have undertaken a study to set performance limits on new lots of the polystyrene standard reference materials for use in SAE J1960 and J1885. Some of these results will be discussed throughout this paper. The point is this: Unfortunately, there is no one perfect benchmark test result. One must expect some variability
The Objective of the Study
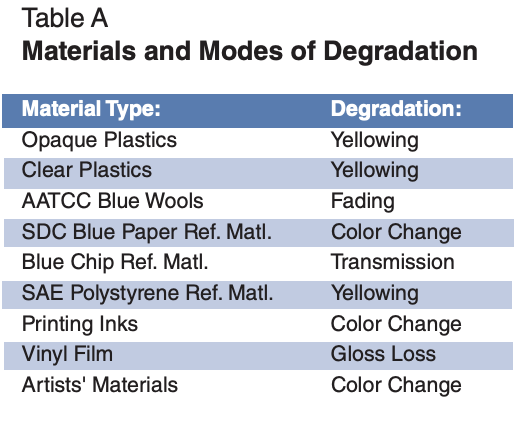
This paper investigates whether xenon arc testers with a flat specimen array can provide results which are functionally equivalent to the results of the oldstyle rotating drum testers. Ultimately, the validity of performance-based standards in practice is being evaluated. In order to determine the correlation between xenon arc exposures conducted in rotating drum specimen mounting systems versus flat array specimen systems, we tested nine different types of materials. The material types and degradation modes of the various comparative exposures are listed in Table A.
This paper will present the comparison test results as a series of summaries. It will demonstrate that performance-based methods can successfully achieve the appropriate results, as long as the critical exposure parameters are properly controlled. The study utilized various models of Q-Sun Xenon Test Chambers for the flat array testers and compared the results to various models of Atlas rotating drum testers. The results show that the Q-Suns produced essentially the same results as the Atlas testers, as long as comparative filter systems and exposure conditions are used.
SAE Polystyrene Reference Materials: Yellowing
As a check on xenon arc tester performance, certain Society of Automotive Engineers (SAE) test methods require that a Polystyrene Reference Material, manufactured by Test Fabrics, Inc., be exposed simultaneously with the material undergoing test. The color change of the reference material (delta b yellowing) is measured periodically. If the change falls within predetermined tolerances, it is assumed that the tester is operating properly. A record of the reference material’s performance is maintained by the testing lab and may be required as part of the test report. The delta b tolerances for the SAE Polystyrene Reference Material are established by the Reference Material Subcommittee of the Committee on Textiles and Flexible Plastics. This is a joint committee of the SAE and the Industrial Fabrics Association International (IFAI). The tolerances are determined by extensive testing of each new lot in multiple Atlas xenon arc testers and are only applicable to a particular lot of reference material. Historically, the data has been developed in Atlas models Ci5000, Ci4000, Ci65A and Ci35A operated by automotive OEMs, Atlas, and certified automotive suppliers. Exposures: In order to determine if the Q-Sun could produce the same color change as the rotating drum testers, SAE Polystyrene Reference Material was exposed in Q-Sun Xe-3-HS testers, equipped with Q/B filters. Exposure tests were performed in two different labs according to SAE J1960 conditions (see the Annex for a description of exposure conditions).
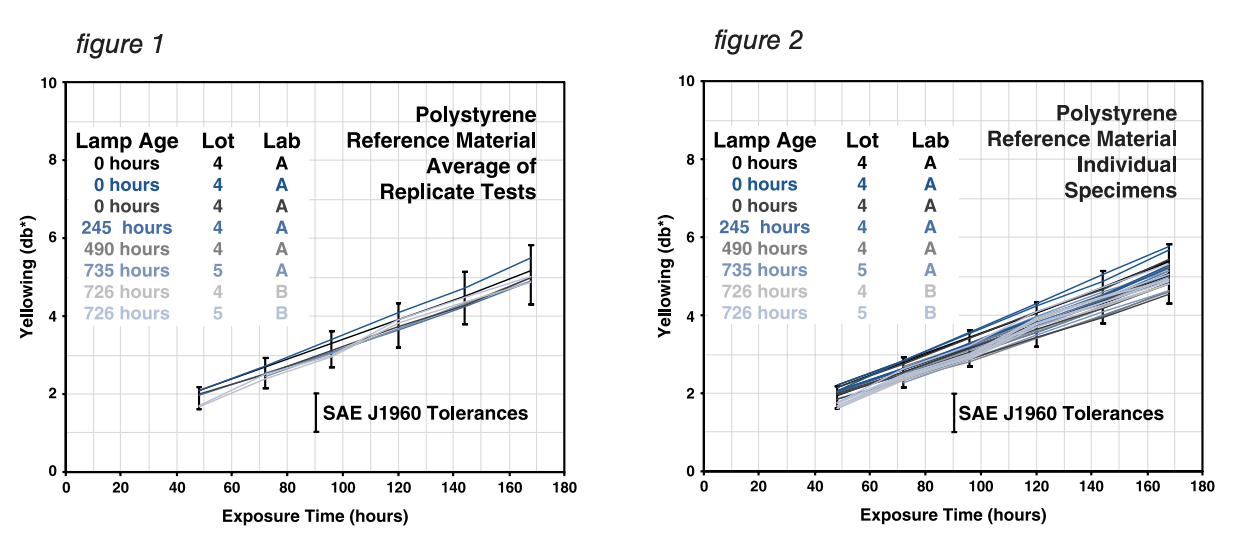
In each test, four replicate specimens of polystyrene were placed in the flat exposure tray of a Q-Sun in a diagonal pattern from the left-front to the right-rear corner. The specimens remained in this position for the duration of the exposure. (Because operating procedures recommend periodic repositioning of the test specimens, this provided a “worst case” test to highlight any potential variability within the chamber.) Color was measured daily for one week in accordance with SAE J1960 instructions. The exposure was repeated eight times, with lamps of different ages, to determine if there was any effect from xenon lamp aging. Conclusions: When compared with the predetermined tolerances, all four replicates, in all eight Q-Sun exposures, performed in two different labs, at every measurement interval (224 measurements in total), fell within the range established by the SAE committee. The first figure shows the average performance of each set of four replicates to quantify any effect of lamp aging. There does not appear to be any effect from lamp aging. The second figure shows the performance of each of the 32 individual polystyrene plaques. For the SAE Polystyrene Reference Material, the flat array Q-Sun Xe-3-HS gave the same test results as rotating drum xenon arc models.
Clear Plastics: Yellowing
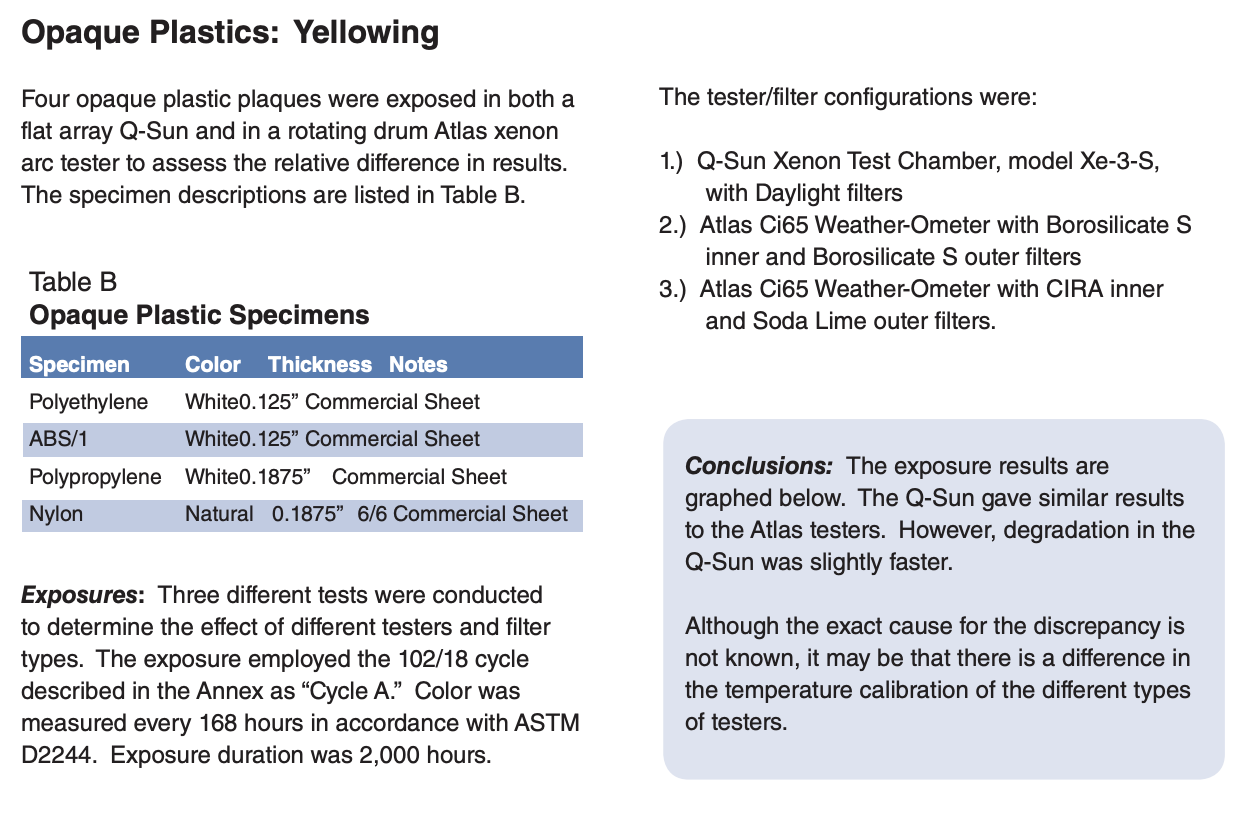
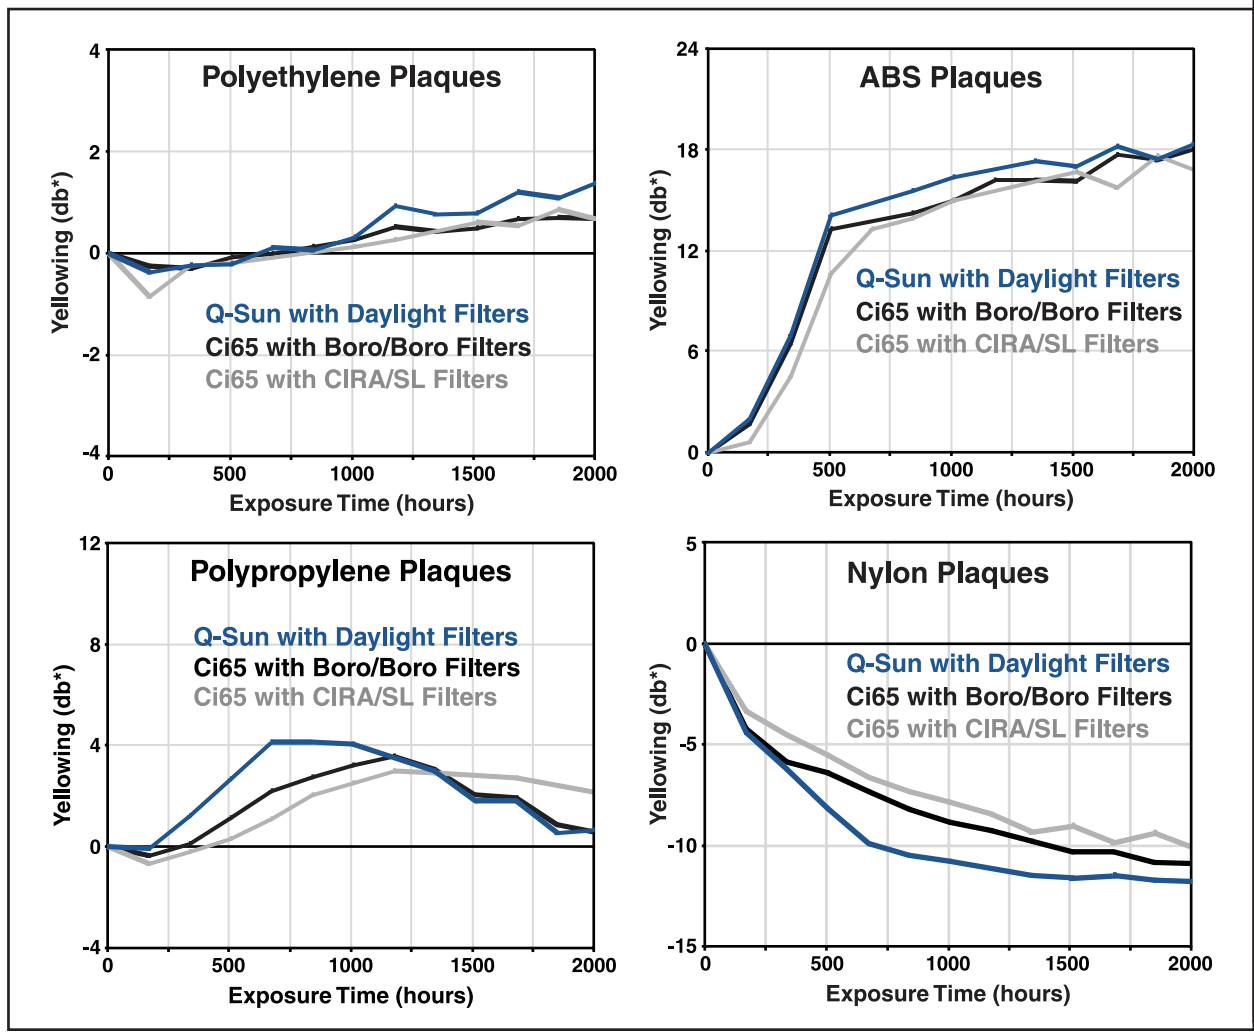
Four clear plastic plaques were exposed in both the Q-Sun and in Atlas xenon arc testers to assess the relative differences in results. The specimen descriptions are listed below: Exposures: Three different exposures were conducted to determine the effect of different testers and filter types. The exposures utilized the 102/18 cycle described in the Annex as “Cycle A.” Color was measured every 168 hours in accordance with ASTM D2244. Exposure duration was 2,000 hours. The tester/filter configurations were: 1.) Q-Sun Xenon Test Chamber, model Xe-3-S, with Daylight filters 2.) Atlas Ci65 Weather-Ometer with Borosilicate S inner and Borosilicate S outer filters 3.) Atlas Ci65 Weather-Ometer with CIRA inner and Soda Lime outer filters
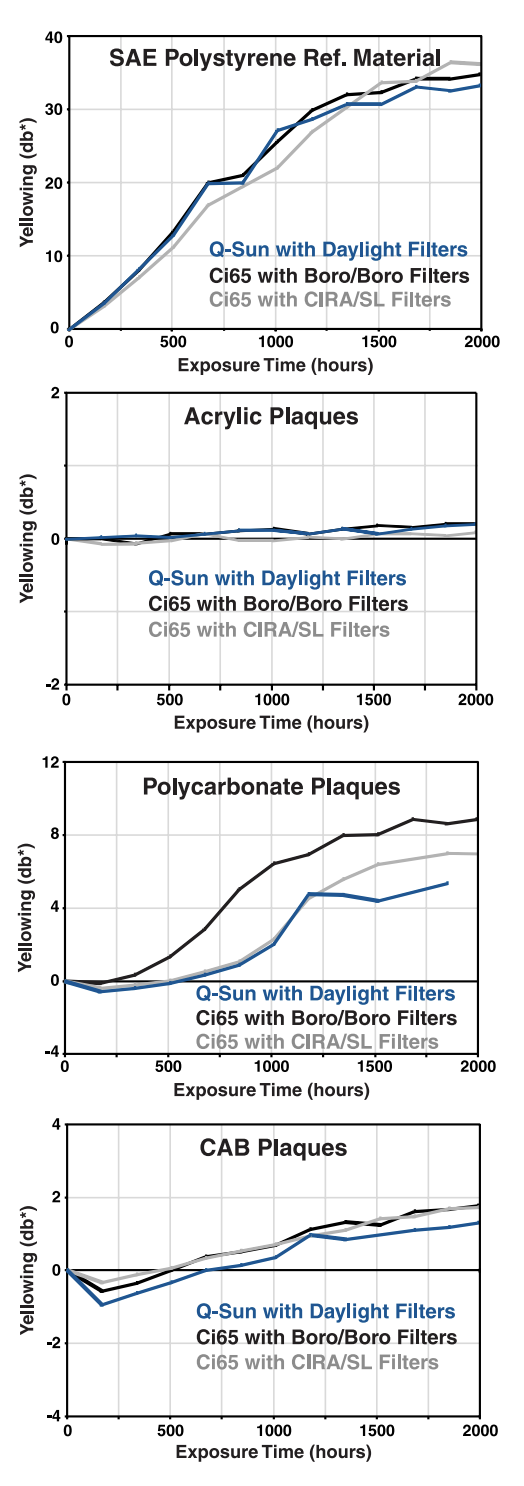
Conclusions: There was virtually no difference in exposure results from the polystyrene, CAB and acrylic. Both testers and all filter types gave essentially identical results. For the polycarbonate, there was good agreement between Q-Sun Daylight and Atlas Ci65 CIRA/SL filter results. However, the boro/boro filters provided a more severe exposure. Presumably this is due to the shorter wavelength UV spectrum that this filter allows.
AATCC Blue Wool Standards: Fading
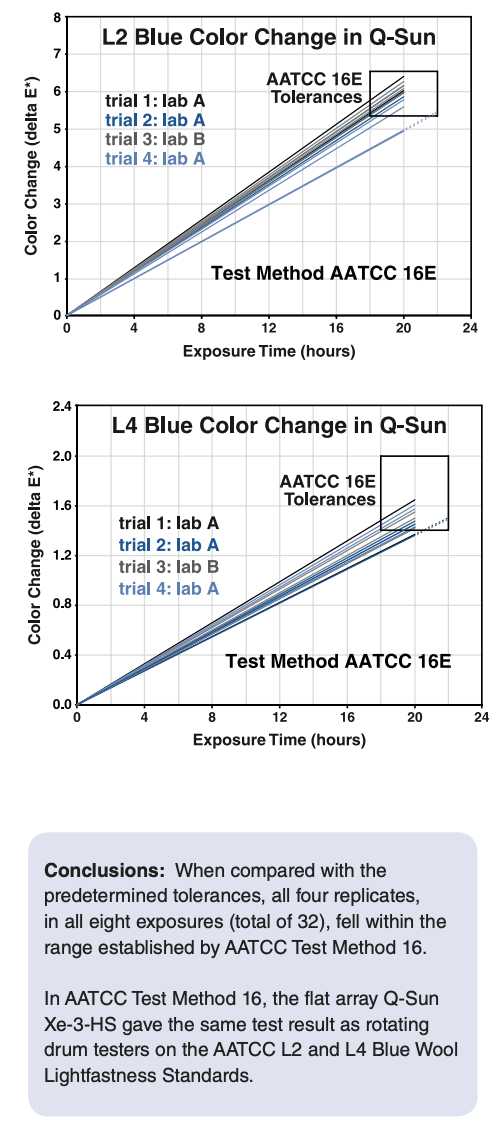
The American Association of Textile Chemists and Colorists (AATCC) Test Method 16, Colorfastness to Light, requires that the operator calibrate the xenon arc device by the use of AATCC Blue Wool Lightfastness Standards prior to the performance of an exposure test. The AATCC offers 8 Blue Wools of varying lightfastness levels ranging from L2 (very fugitive) to L9 (very lightfast). The most commonly used standards are L2 and L4. The Blue Wools are exposed to continuous light for 20 +/-2 hours at the appropriate temperature, humidity, etc. After exposure, the material is evaluated for fading by either visual or instrumental procedures. Each new production lot of Blue Wool is extensively tested by AATCC Committee RA50 on Lightfastness in multiple rotating drum style xenon arc testers. Historically, the exposure tests have been performed in Atlas models Ci35, Ci65, Ci5000, Ci4000, and Ci3000 operated by the AATCC Lab, Atlas, and members of Committee RA50. A new lot is released only after it has been determined that it performs suitably. Exposures: In order to determine if the flat array Q-Sun could produce the same color change as rotating drum testers, a series of L2 and L4 Blue Wool exposures were run in a Q-Sun Xenon Test Chamber, model Xe-3-HS. The Q-Sun was operated at method 16E test conditions for 22 hours (see the Annex for a full description of the 16E conditions). After exposure, the color was measured in accordance with AATCC Evaluation Procedure 6. For each test, four replicate specimens of the AATCC Blue Wool Lightfastness Standards were placed in the exposure tray of the Q-Sun in a diagonal pattern from the left-front to the right-rear corner. The specimens remained in this position for the duration of the exposure. The exposure was repeated four times with L2 and four times with L4.
SDC Blue Paper Reference Material: Color Change
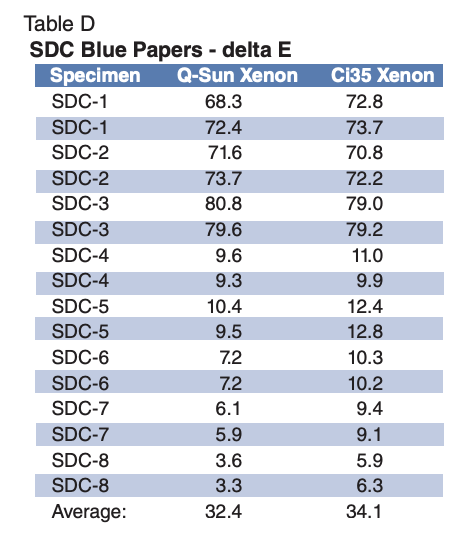
The Society of Dyers & Colourists (SDC) supplied specimens of blue pigmented papers of varying lightfastness (Lightfastness Standards 1-8) for a study. These experimental papers are intended to have a similar use as the ISO Blue Wools as a reference material. The SDC Lightfastness Standards vary in pigment formulations and in sensitivity to UV light. Exposures: The SDC papers were exposed in a Q-Sun and in an Atlas Ci35 in accordance with ASTM D4303, Standard Test Methods for Evaluating Lightfastness of Artists’ Pigments, Method C (see Annex for a description of exposure conditions). Instrumental color measurements were performed before and after exposure in accordance with ASTM E 1349 and D 2244. The tester/filter configurations were: 1.) Q-Sun Xenon Test Chamber, with Window Glass filters 2.) Atlas Ci35 Weather-Ometer with Borosilicate S inner and Soda Lime outer filters. Results: The color change is reported in total color difference units (delta E). Following is the data shown in Table D and the graph below.
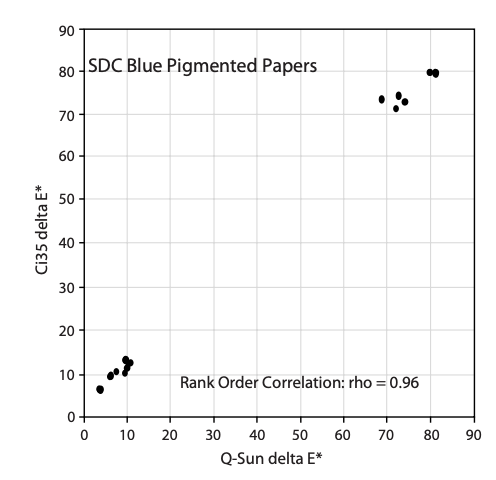
Conclusions: Although there were some minor discrepancies in the absolute color change values, as shown in the accompanying figure, the Spearman Rank Order Correlation between the two exposures was an excellent 0.96. Rankings of 0.90 and higher indicate very close correlation. If there is perfect agreement in ranking, the Spearman rho will have a value of 1.0. The two different testers gave the same color change results.
Blue Chip Reference Material: Transmission
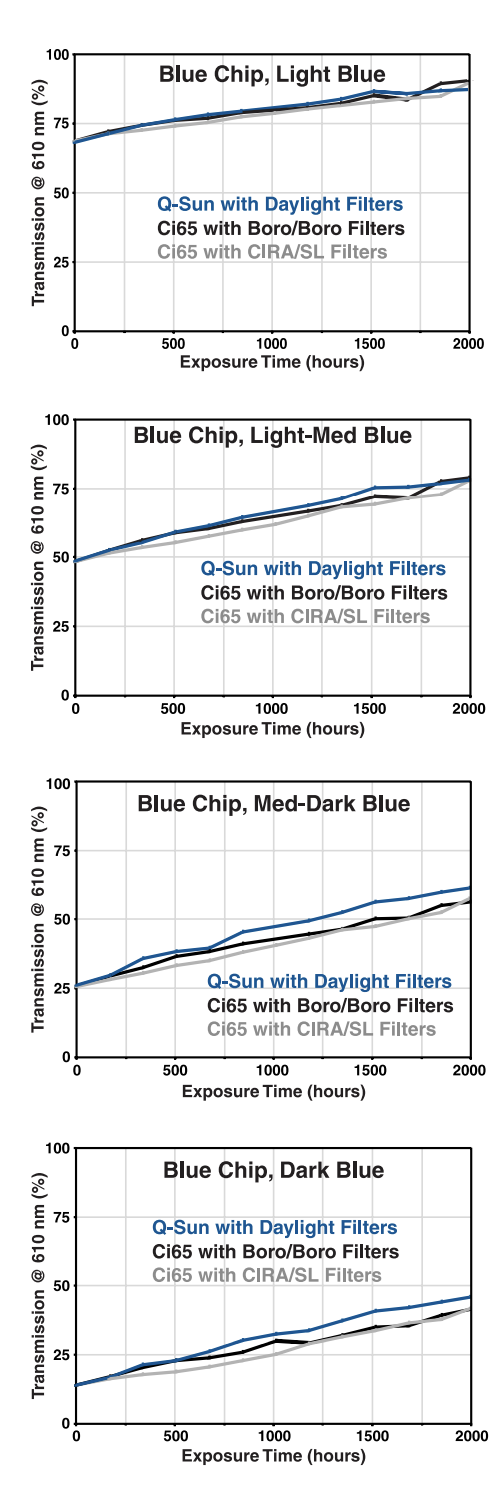
A series of translucent blue plastic plaques developed by Textile Innovators, Inc., have been used in studies by technical committees of the American Association of Textile Chemists and Colorists (AATCC) and the International Standards Organiza - tion (ISO) as potential reference materials for use in weathering and lightfastness studies. The effects of exposure are determined by measuring the change in either reflectance or transmission at 610 nm. The intent was to use these “Blue Chips” in weathering tests. The Blue Chips could thereby complement the AATCC Blue Wools by providing a reference material which could withstand water spray. The Blue Chips are 0.125 inches thick. Exposures: Four different chips, designed to provide varying levels of lightfastness, were exposed in both the Q-Sun and an Atlas xenon arc tester to assess the relative differences in results. Three different exposures were conducted to determine the effect of different testers and filter types. The exposures used the 102/18 cycle described in the Annex as “Cycle A.” Degradation was monitored by measuring transmission at 610 nm every 168 hours in accordance with ASTM D2244. Exposure duration was 2,000 hours. The tester/filter configurations were: 1.) Q-Sun Xenon Test Chamber, model Xe-3-S, with Daylight filters 2.) Atlas Ci65 Weather-Ometer with Borosilicate S inner and Borosilicate S outer filters 3.) Atlas Ci65 Weather-Ometer with CIRA inner and Soda Lime outer filters.
Conclusions: As shown in the figures, the change was linear for all of the chips, regardless of the tester used. The differences in xenon spectra from the different filters used in the two Ci65 exposures seem to have had no significant effect on the Blue Chip exposure results. There was no significant difference in the results between the rotating drum testers versus the flat array Q-Sun Xe-3-S.
Artists' Materials: Color Change
ASTM Subcommittee D01.57 on Artists’ Materials conducted a study to determine the correlation between various exposure methods on a series of 15 colored artists’ pencils. Although the study also included outdoor exposures under glass, for this paper we will only focus on a comparison of the results from a Q-Sun and an Atlas Ci35. (For a full discussion of the data, including correlation to outdoors, see Brennan & Everett, 2000). Three manufacturers participated in the study. Each prepared two replicate specimens of five different colored pencil types. Each pencil type was applied to a replicate paper substrate. To provide a representative spread in the data, the specimens provided by the manufacturers were of various colors and durability levels, ranging from very good to very poor. Exposures: The specimens were exposed in a Q-Sun and in an Atlas Ci35 in accordance with ASTM D4303, Standard Test Methods for Evaluating Lightfastness of Artists’ Pigments, Method C (see Appendix for a description of exposure conditions). Instrumental color measurements were performed before and after exposure in accordance with ASTM E 1349 and D 2244. The tester/filter configurations were: 1.) Q-Sun Xenon Test Chamber, with Window Glass filters 2.) Atlas Ci35 Weather-Ometer with Borosilicate S inner and Soda Lime outer filters.
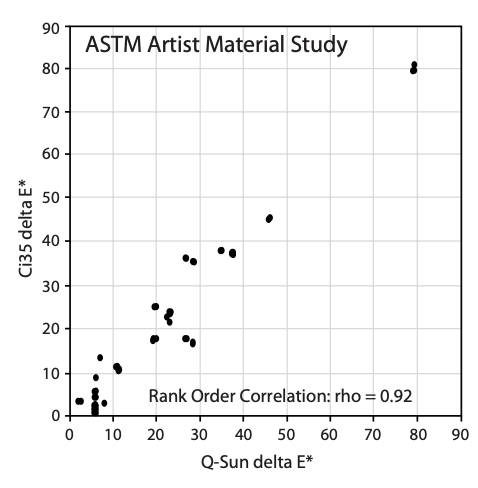
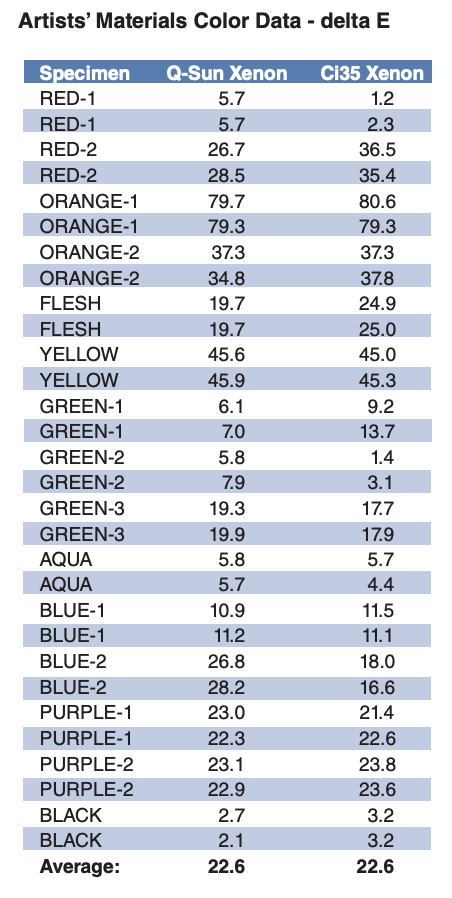
Results: The color change was reported in total color difference units (delta E). There was a wide range of durability in the test specimens. The exposure results are shown in Table E. Table E
Conclusions: Although there were some discrepancies in the absolute color change values, the Spearman Rank Order Correlation between the two exposures was an excellent 0.92.
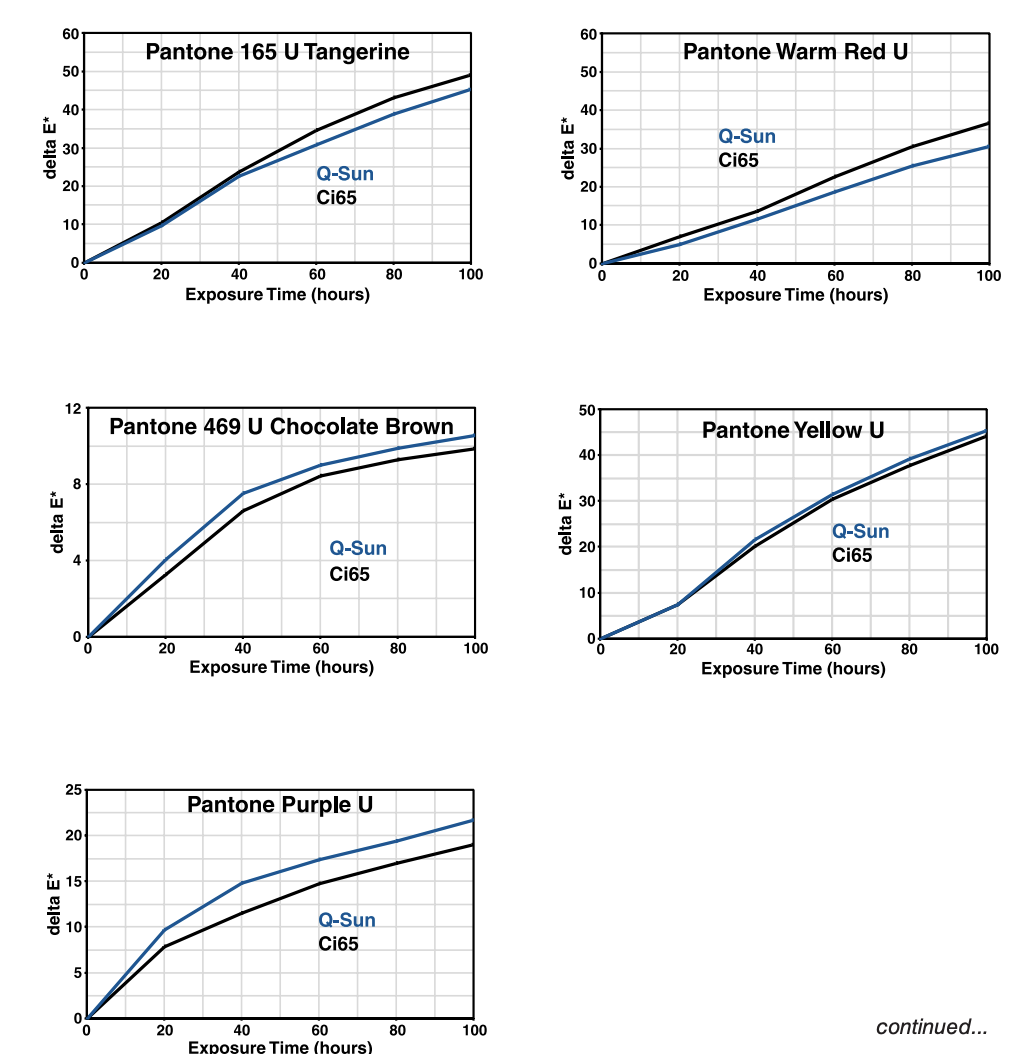
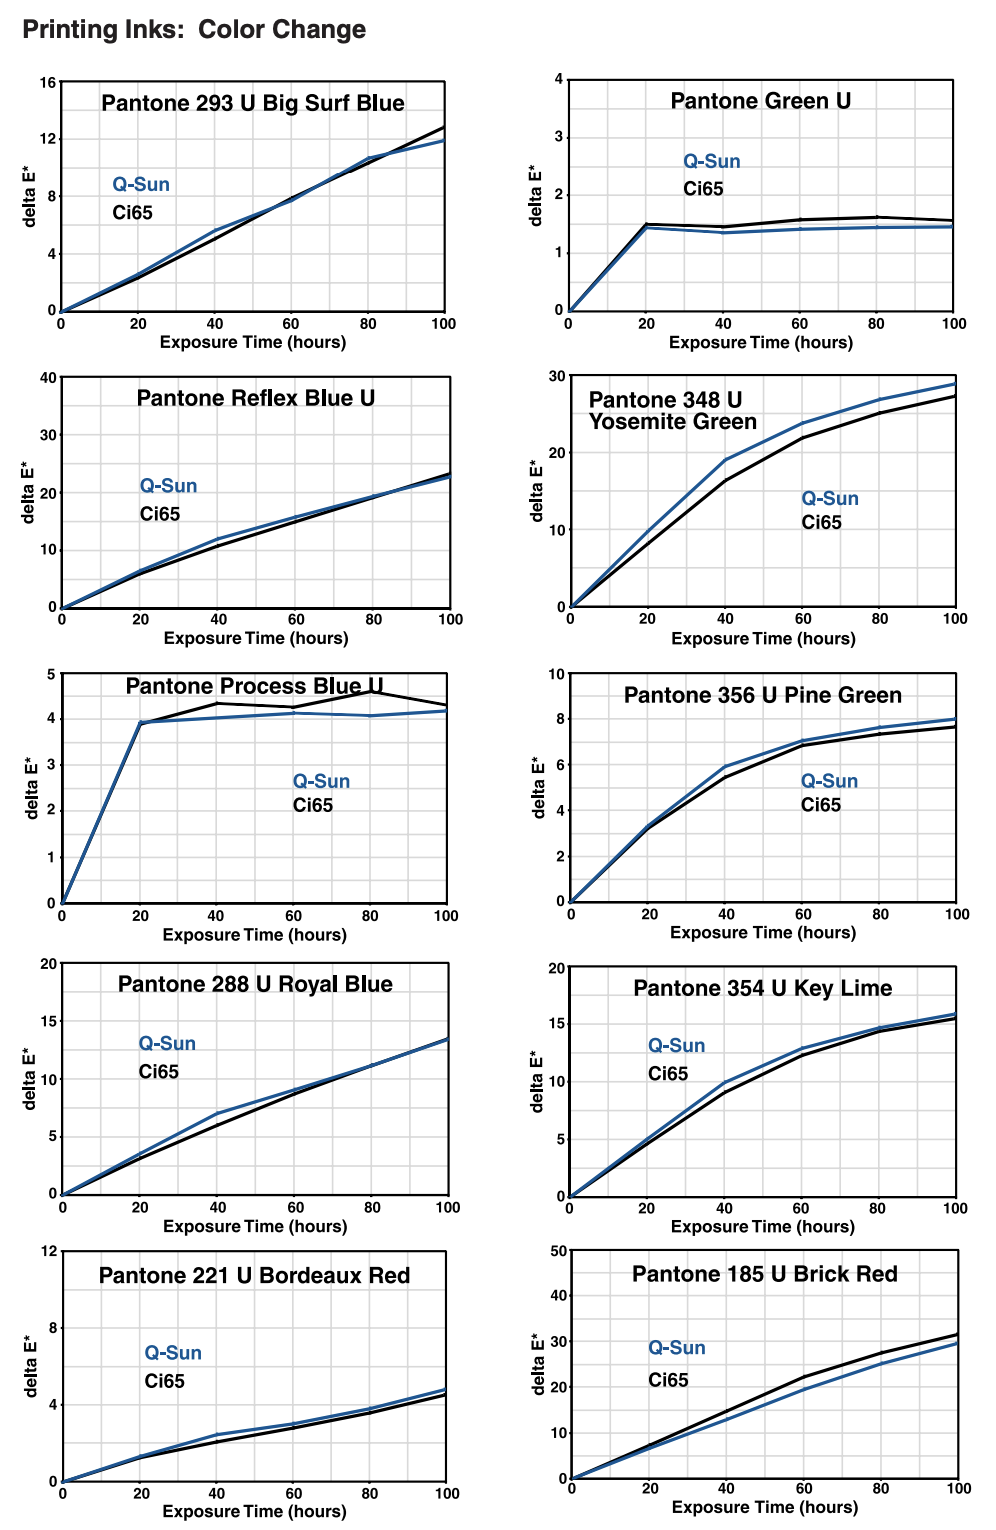
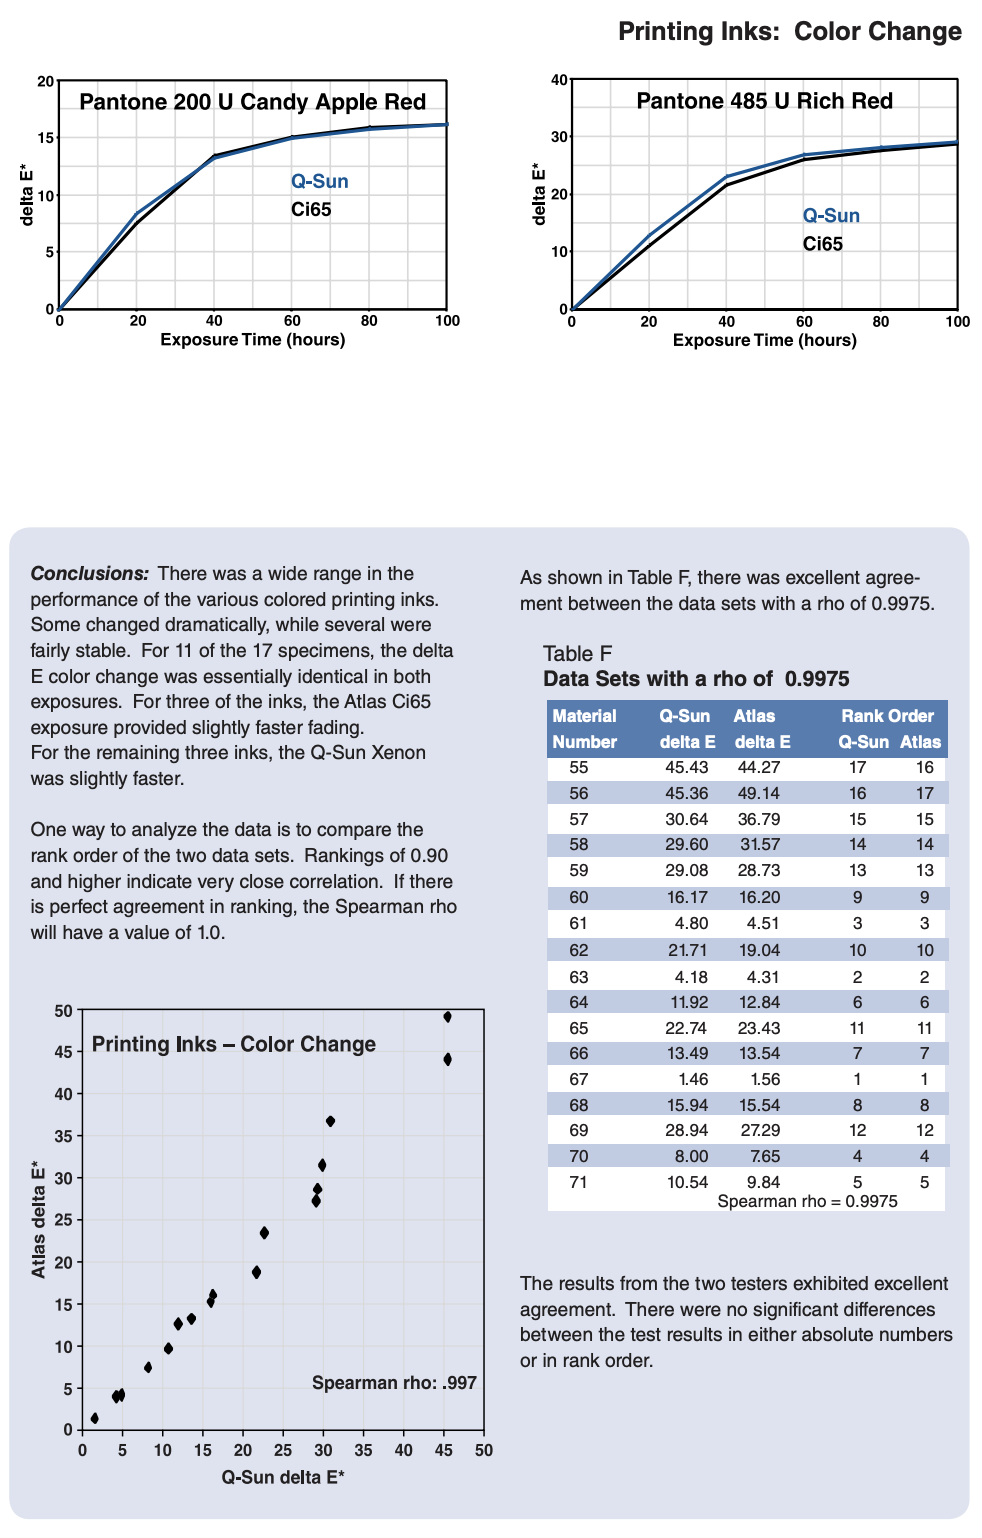
Printing Inks: Color Change
Historically, carbon arcs were used to test the lightfastness of printing inks. However, over the last 15 years, most labs have switched to xenon arc because the xenon’s spectrum allows a much more realistic exposure test. Seventeen ink formulations from one manufacturer were tested to determine the relationship between the rotating drum style and flat array style xenon testers.
Vinyl Film: Gloss Loss
Fischer and Ketola of 3M have published several papers examining the data generated by ASTM Committee G03 (on Weathering and Durability) on the precision, repeatability and reproducibility of various types of weathering testers. These studies employed a series of 10 different colored polyvinyl chloride films (0.002 inch thick, with pressure sensitive adhesive) provided by 3M. The films were applied over aluminum test panels. These particular specimens were chosen for the ASTM studies because the durability (gloss retention) varies significantly among the ten materials. In order to determine the correlation in test results between rotating drum and flat array xenon testers, these same 3M films were used in a comparative study. Exposures: Three different exposures were conducted to determine the effect of different testers and filter types. The exposures employed the 102/18 cycle described in the Annex as “Cycle A.” Gloss loss (60o ) was measured every 168 hours in accordance with ASTM D523. Exposure duration was 2,000 hours. The tester/filter configurations were: 1.) Q-Sun Xenon Test Chamber, model Xe-3-S, with Daylight filters 2.) Atlas Ci65 Weather-Ometer with Borosilicate S inner and Borosilicate S outer filters 3.) Atlas Ci65 Weather-Ometer with CIRA inner and Soda Lime outer filters.
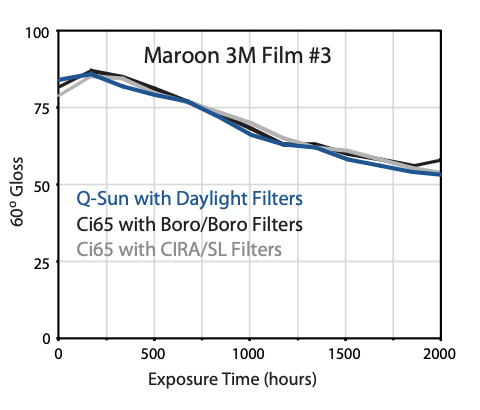
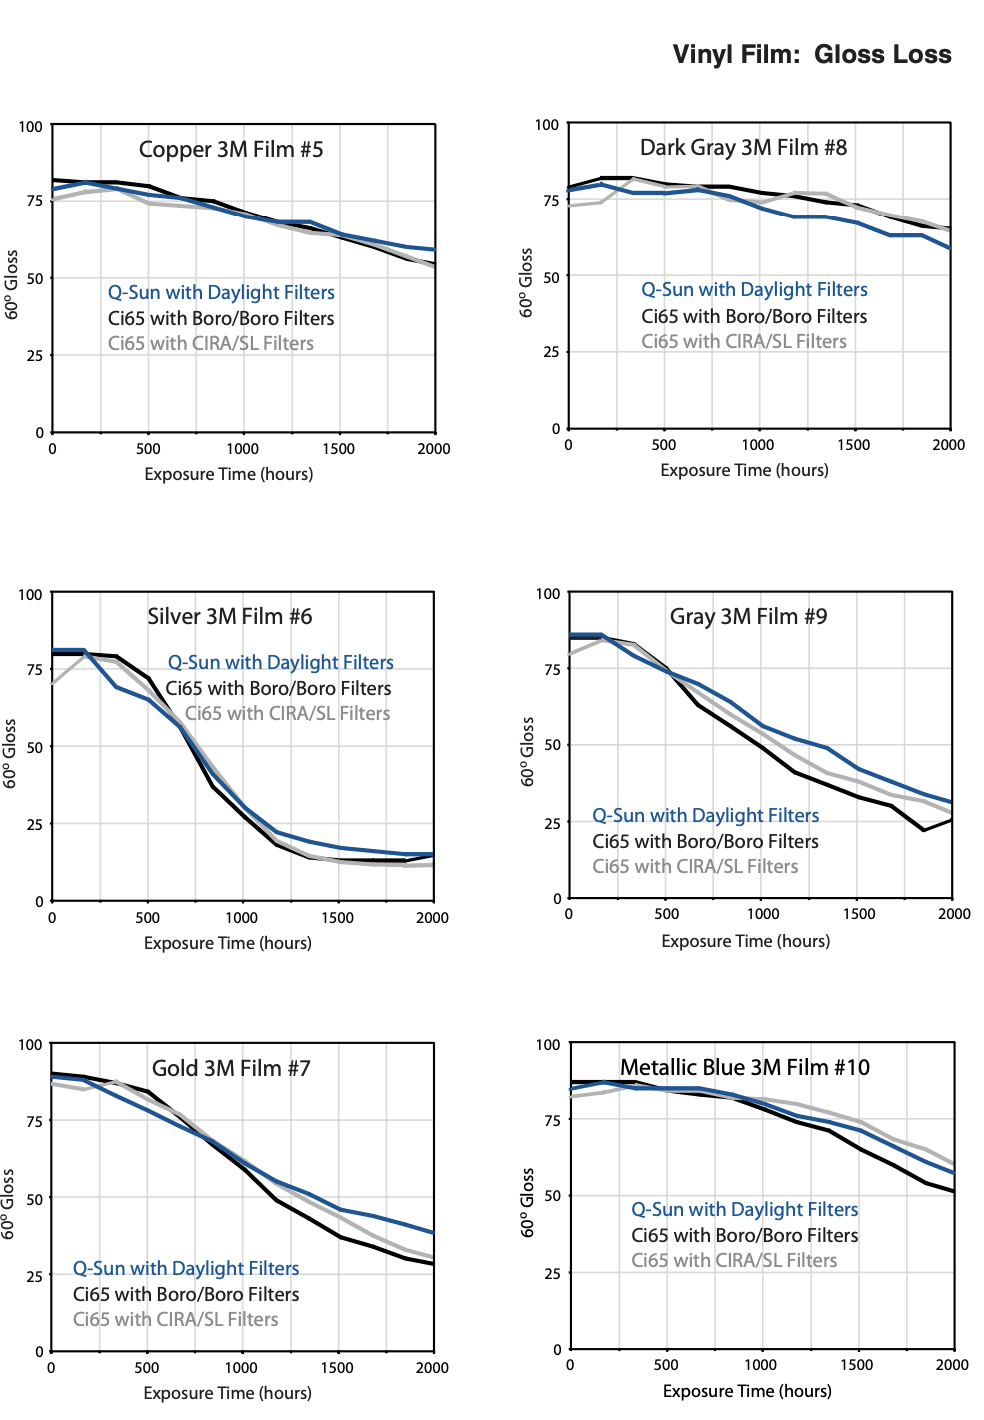
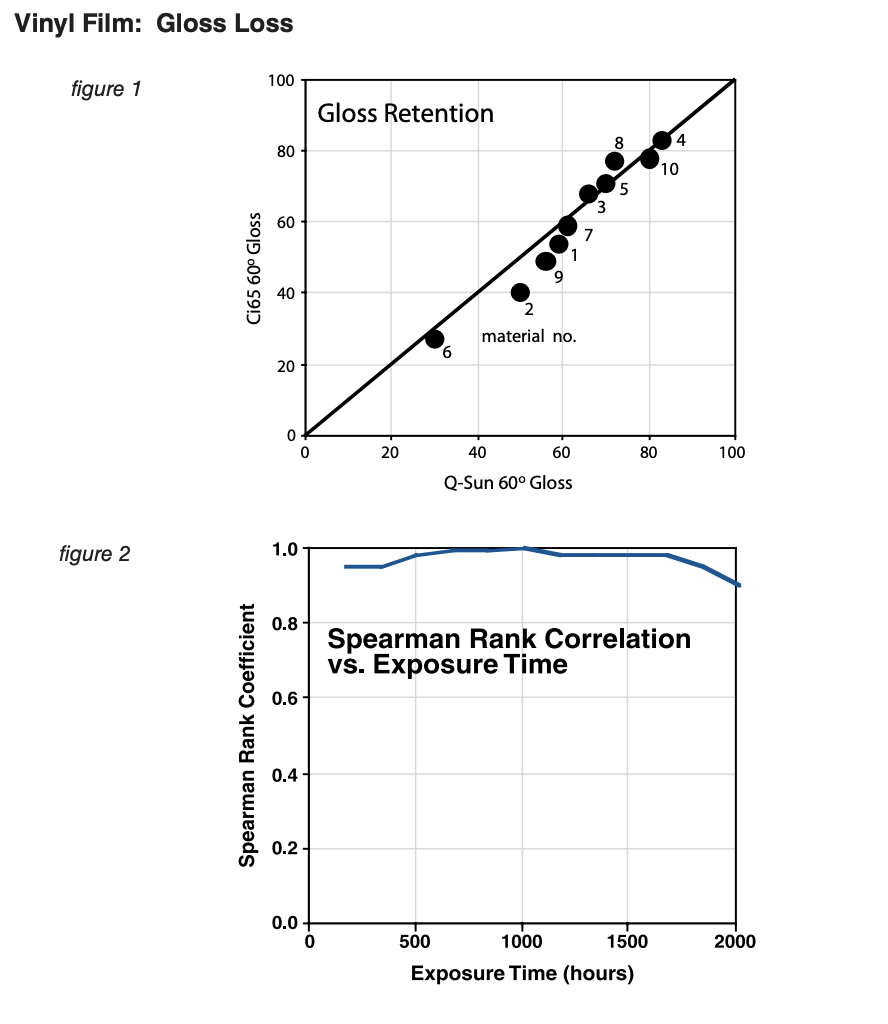
Conclusions: Initial gloss measurements of the unexposed specimens ranged from 75 to 85. After 2000 hours exposure, the gloss ranged from 15 to 75. One way to look at the relationship of the data is to plot the Ci65 results vs the Q-Sun results as shown in the figures above. If the two testers gave the exact results in absolute numbers, the data would line up exactly on the 45o diagonal line bisecting the graph. As illustrated in figure 1, there was extremely good agreement between the two data sets. A third way to analyze the data is to compare the rank order of the two data sets. As shown in figure 2, there was perfect agreement between the data sets after 1000 hours exposure. Regardless of the time interval, the rho was better than 0.9. The Q-Sun and the Ci65 showed excellent correlation on the 3M vinyl films. Given the normal range of precision, repeatability and reproducibility in xenon testers, it would be unlikely that two exposures done in the same tester would give any closer results.
Summary & Conclusions
- In the nine studies documented in this paper, involving numerous material categories and degradation modes, remarkably good agreement was achieved between the flat array and rotating drum xenon exposures. The results indicate that the concept of performance-based test protocols can be successful, as long as comparative filter systems and exposure conditions are properly defined and utilized. Almost all differences in exposure results fall within the normal variability one would expect from any two testers, regardless of the model or manufacturer.
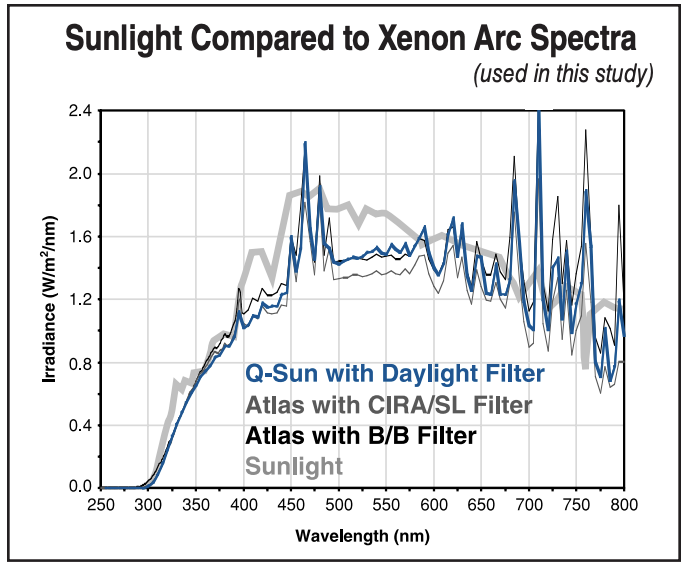
- The Q-Sun Daylight filters and the Atlas CIRA/SL filters are a better match with each other (and with sunlight). However, certain filter systems (notably the Borosilicate/Borosilicate combination used in the rotating drum testers) may, in some instances, give more severe (i.e., faster) results on some materials. Presumably, this is because they transmit unnaturally short UV wavelengths.